
Where your health insurance money goes
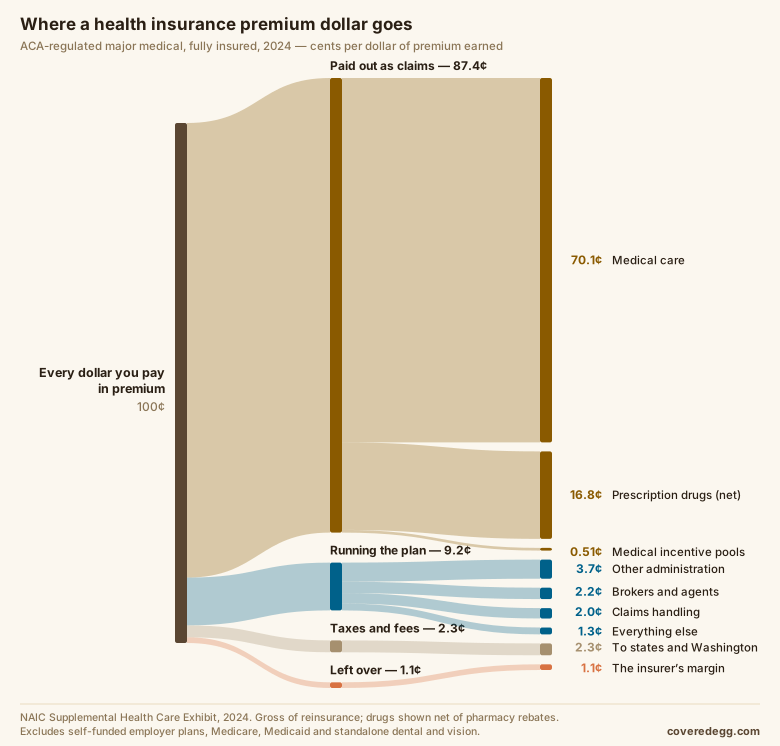
The short version: Health insurers have to file an itemised public accounting of what happens to every premium dollar, and for 2024 it comes to this: 87.4 cents of every major-medical premium dollar went back out as claims. Most of that — 70.1 cents — paid for medical care, and 16.8 cents paid for prescription drugs after rebates. Running the plan took 9.2 cents, of which 2.2 went to brokers and agents. Taxes and regulatory fees took 2.3 cents. What the insurer had left at the end was 1.1 cents — before investment income, and before tax.
Most arguments about health insurance are arguments about a number nobody looks up. It is worth looking up, because insurers are required to publish it in more detail than almost any other industry publishes anything.
Every issuer of ACA-regulated major medical files a Supplemental Health Care Exhibit with the National Association of Insurance Commissioners. It exists so regulators can check the law's medical loss ratio floor, and it does that by making insurers itemise their entire outflow: claims split from drugs, drugs split from rebates, commissions split from salaries, premium taxes split from regulatory fees. The parts are required to add to the whole, and they do.
For 2024, across the 50 states and the District of Columbia, that exhibit covers $420.8 billion of earned premium and 59.3 million covered people — an average of $592 per member per month. Here is where it went.
The 87 cents that leaves as claims
The single biggest fact about health insurance is that it is mostly a pass-through. Of every premium dollar, 87.4 cents went straight back out as incurred claims. That is a higher share than almost any property or casualty line manages — homeowners, auto and pet insurance all pay back far less of what they collect, which is the comparison the rest of our payback ranking makes.
What is interesting is the split inside it. Prescription drugs cost 24.8 cents of the premium dollar — nearly a quarter — and pharmacy rebates brought 8.0 cents of that back, leaving a net 16.8. So roughly one dollar in five of what your insurer pays out is a pharmacy bill, and about a third of the gross drug spend comes back through a rebate you never see. The remaining 70.1 cents is everything else medicine does: hospitals, physicians, outpatient care, emergency rooms, referrals.
The 9 cents of running the plan
This is the part people assume is enormous, and it is not. Nine cents and change covers the entire apparatus of being an insurance company:
- 3.7 cents — general administration: staff, systems, buildings, everything not otherwise named.
- 2.2 cents — brokers and agents. This is the commission paid to whoever sold the policy, and it is the single largest identifiable selling cost in the exhibit.
- 2.0 cents — claims handling: 0.9 for cost containment (utilisation review, network management, negotiating what a procedure costs) and 1.1 for the ordinary work of adjudicating and paying claims.
- 1.3 cents — everything else, which itemises as 0.61 for quality improvement programmes, 0.56 for the insurer's own sales staff, 0.14 in miscellaneous taxes and 0.01 for fraud detection.
The broker figure is the one worth sitting with. Buying the same coverage through a different channel changes what you pay for it, which is a pattern that shows up across insurance — we looked at it for property lines in how the way you buy changes what you pay.
The 2.3 cents of tax
State insurance and premium taxes take 1.18 cents, federal taxes and assessments 0.85, and regulatory licences and fees 0.26. This is money that never had any chance of paying for care, and it is roughly twice what the insurer itself kept.
The 1.1 cents left over
After claims, administration and tax, the underwriting margin on this book was 1.1 cents on the dollar. That is not the insurer's profit — investment income is added to it and corporate income tax comes out of it — but it is what the insurance operation itself produced.
It is a thin number, and it is thin for a structural reason: the ACA requires large-group plans to spend at least 85% of premium on care and quality and individual and small-group plans at least 80%, with rebates owed to customers if they fall short. A business with a statutory floor under its payout ratio does not get to run a wide margin, and this one does not.
Two numbers that are not this number
The exhibit's headline figure is the medical loss ratio, and for 2024 it was 89.8%, not 87.4%. Both are correct and they measure different things. The federal MLR adds quality-improvement spending and fraud-detection expense to the numerator, and removes taxes and regulatory fees from the denominator — because the law is asking "of the money the insurer got to keep and spend, how much went to care?" That is the right question for enforcing the 80/85% floor. The 87.4 cents on this page is the simpler question: of the dollar you handed over, how much came back as claims? We use the simpler one here so it can sit beside the loss ratios we publish for auto, home and pet.
The second number is the spread. That 87.4 is a national average, and it moves a long way by state: from 77.0% in Missouri to 99.0% in Vermont, with a median of 88.1%. A Vermont insurer paid out essentially every dollar it collected.
What this does not cover
This is fully insured, ACA-regulated major medical and nothing else. It excludes:
- Self-funded employer plans, where the employer pays claims from its own money and hires an insurer only to administer them. That is how most large employers cover most of their workers, and it is invisible here.
- Medicare, Medicare Advantage and Medicaid, which are separate books on separate reports.
- Standalone dental and vision, which behave very differently — the published payout ratios for those lines are struck on a revenue base that includes fee income, not just premium.
- Most of California. California's major health plans — Kaiser, Blue Shield of California, Health Net — are licensed by the Department of Managed Health Care rather than the insurance department, and file no NAIC annual statement at all. Only a small indemnity slice of the state appears in this exhibit, so the national totals here are missing a large part of the country's biggest health market.
Source: NAIC Supplemental Health Care Exhibit, 2024 data year, comprehensive individual, small group and large group combined across the 50 states and the District of Columbia. Figures are cents per dollar of health premiums earned (exhibit line 1.1), gross of reinsurance, with prescription drugs shown net of pharmacy rebates. The medical loss ratio quoted is the federal calculation, (net incurred claims + quality improvement + fraud detection) ÷ premium net of taxes and regulatory fees.