
Which insurance actually pays you back
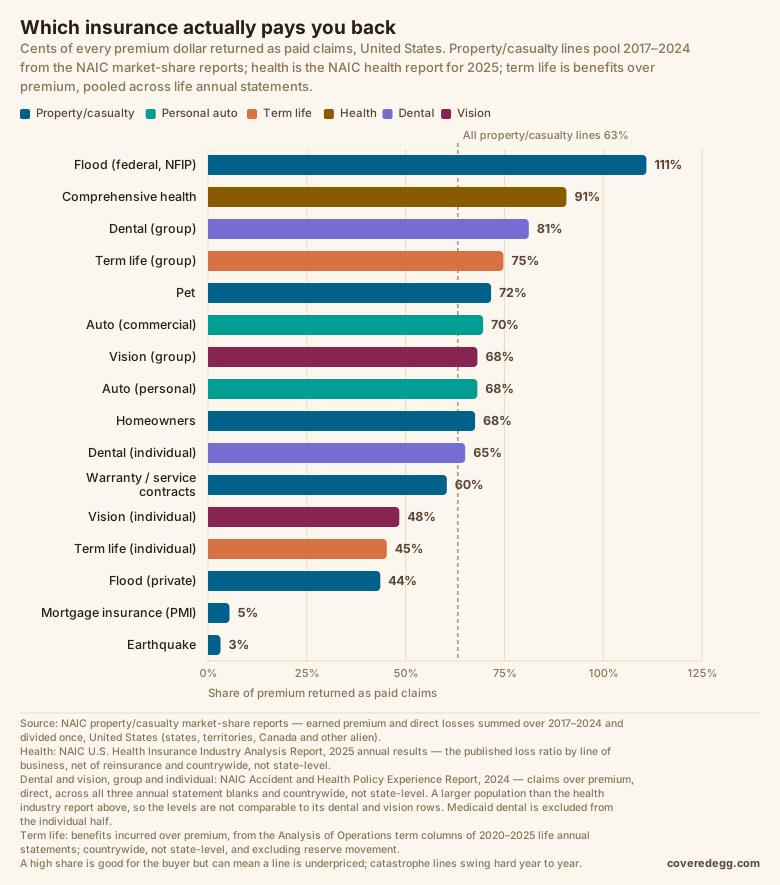
The short version: There is one number that says how much of an insurance premium is actually buying cover rather than paying for everything else, and regulators make insurers report it: the share of premium that goes back out as paid claims. Across every property/casualty line written in the United States between 2017 and 2024 it was 63%. But the spread underneath that average is enormous. Comprehensive health returns 91% of premium as claims; earthquake returns 3%. Both are legal, both are normal, and the difference is mostly about what kind of product you are really buying.
The measure
Every insurer files a statement with regulators showing, state by state and line by line, how much premium it earned and how much it paid in claims. Divide the second by the first and you get the direct loss ratio — the cents of each premium dollar that came back as claims. The NAIC publishes the totals in its market-share report, and that report is what this ranking is built on. It is the whole industry, not a sample.
The figures here are pooled over 8 years, 2017 to 2024. That is not a stylistic choice: for half the lines on this page a single year is barely a measurement. Federal flood returned 26% of premium in 2020 and 238% in 2024. Earthquake sat at 1.4% in 2024 and 10.5% in 2020. Mortgage insurance ran negative in 2022 — it released more reserve than it paid out. Rank those on one year and you have ranked the weather. So every year's premium and every year's losses are added up first, and divided once at the end.
Everything not in that number went somewhere else: handling the claims, paying agents, advertising, salaries, taxes, and profit. A line paying back 72% is one where most of your money is genuinely earmarked for losses. A line paying back single digits is one where it mostly is not.
Two honest warnings before the ranking, because "higher is better" is close to true but not quite:
- A ratio that is too high is a warning, not a bargain. A line paying out more than it takes in is underpriced, and underpriced lines get repriced. If you are shopping in one, expect the renewal to move.
- A low ratio can be structural rather than greedy. Earthquake and mortgage insurance are catastrophe and credit covers: they pay rarely and enormously. Eight years is long enough to make that argument honestly and still not long enough for a once-in-a-century earthquake, so read those two lines as "has not paid yet" rather than "does not pay".
We wrote the longer version of this argument in how much of your premium actually comes back as claims.
What pays back the most
Two things put a line at the top. The first is frequency: where claims are an ordinary event rather than a disaster — a doctor's visit, a dented bumper, a dog that swallowed a sock — the insurer is running a claims business rather than selling a lottery ticket, so most of the premium has to be reserved for claims and there is little room in the price for anything else. The second is who does the buying: health and group life are mostly bought by employers and governments negotiating for thousands of people at once, and it shows. Health also has a floor by law — the Affordable Care Act requires most plans to spend at least 80–85% of premium on care or refund the difference.
- Comprehensive health, 91% — 28 points above the all-lines average. Major medical — the ACA marketplace plan and the plan an employer buys, together.
- Dental (group), 81% — 18 points above the all-lines average. Standalone dental bought through an employer.
- Term life (group), 75% — 12 points above the all-lines average. Employer-provided term cover, priced on a whole workforce.
- Pet, 72% — 9 points above the all-lines average. Its own statutory line since 2022.
- Auto (commercial), 70% — 7 points above the all-lines average. The same cover sold to a business, for its vans, trucks and fleet.
What pays back the least
The bottom of the list splits into two groups, and they deserve very different reactions.
The first is genuine catastrophe cover — earthquake above all — which pays almost nothing across eight quiet years and everything in the year it finally goes. A low ratio there is the shape of the product, not a verdict on it.
The second is the group worth being annoyed about: cover sold to you by someone who is not the one relying on it. Mortgage insurance is the clearest case — you pay the premium, and the policy protects the lender.
- Earthquake, 3% — 60 points below the all-lines average. A catastrophe cover that pays rarely and hugely.
- Mortgage insurance (PMI), 5% — 58 points below the all-lines average. You pay it; it protects the lender, not you.
- Flood (private), 44% — 19 points below the all-lines average. Private-market flood, outside the federal program.
- Term life (individual), 45% — 18 points below the all-lines average. Individually underwritten term — the policy you buy yourself.
The line that pays back more than it takes in
Federal flood — the National Flood Insurance Program — paid 111% of premium out as claims across 2017–2024, on $23.8B of premium. It is the only line on this page that has paid out more than it collected over the whole window, and it is not a market: the NFIP is a government program that is allowed to run at a loss, and does.
It is also the clearest case for pooling. In 2024 alone the NFIP returned 241% — a hurricane year — and in 2020 it returned 26%. Neither number describes the program. The eight-year figure does.
Term life, which the market-share report does not cover
Life insurers file a different annual statement, so term life appears nowhere in the NAIC's property/casualty market-share report. We read it out of the life blank instead — specifically the Analysis of Operations, which breaks each carrier's book into columns by product and gives the term column its own premium and benefit lines. That keeps whole life and universal life out of the ratio, which matters, because most of a whole-life premium is savings rather than cover and folding it in would make the number meaningless.
The two kinds of term life are 30 points apart, and the gap is the most instructive thing on this page:
- Group term life, 75% — the cover your employer buys. It is priced on a whole workforce with no individual underwriting, sold once to a benefits manager who is comparing quotes, and it carries almost no acquisition cost per life covered. 131 carriers, $72.9B of premium.
- Individual term life, 45% — the policy you buy yourself. Same product, underwritten one person at a time, sold through an agent who is paid a large share of the first year's premium. 224 carriers, $50.4B of premium.
Neither number is a scandal, and the individual figure is not evidence that individual term is a bad buy — most people cannot get group cover for the amount or the duration they need, and group cover ends when the job does. But it is a clean measurement of what distribution costs: the same promise, bought two ways, with 30 cents on the dollar of difference in how much of the premium reaches a beneficiary.
Term life is measured differently from the property/casualty lines and is not strictly comparable: it is benefits incurred over premium, pooled across every life annual statement we hold from 2020 to 2025 rather than a single year, it is countrywide only because the life blank reports the term columns with no state split, and it excludes the movement in policy reserves that a level-term book builds up.
Health insurance, the biggest line of all
Health insurers file a third kind of annual statement, so health appears nowhere in the property/casualty market-share report either — and it is by far the largest thing in the room. The health blank carried $1,313.4B of earned premium in 2025 against $1,194.0B of claims across 296 million memberships — memberships rather than people, because someone with a medical plan and a dental plan is two of them.
It also pays back more than almost anything on the chart above, which is mostly a statement about how it is regulated: the Affordable Care Act sets a floor under the medical loss ratio for comprehensive plans and makes insurers rebate the difference when they miss it, and Medicare and Medicaid plans are priced against government rate-setting rather than against each other.
- Comprehensive health, 91%. Major medical — the ACA marketplace plan and the plan an employer buys, together.
- Medicare Advantage, 90%. Medicare bought through a private insurer rather than from the government.
Read those the way the rest of this page asks you to. The health industry as a whole ran a combined ratio of 100.6% in 2025 — it paid out more than it took in — on a profit margin of 0.4%, the thinnest in the eleven years the report holds. A payback rate this high is the warning at the top of this article in its clearest form: these are lines about to be repriced, and the 1,156 carriers filing say so in their own numbers.
The spread inside health runs the same way it does everywhere else on this page, and for the same reason. Medicare Supplement pays back 87% — it is sold one person at a time, with an agent commission in the price. The two lowest are vision at 73% and dental at 81%, which are also the two where the cover carries an annual cap low enough that most of a large bill lands back on you.
Dental and vision are one row each and two markets underneath
Four of the bars above are split in a way none of the others are. Standalone dental and standalone vision are each bought two completely different ways — through an employer, or one person at a time — and the two pay back very differently. The NAIC Accident and Health Policy Experience Report for 2024 ranks every writer of both twice, once for each, and the halves come apart: group dental 81% against individual dental 65%, 16 points apart, and group vision 68% against individual vision 48%, 20 points apart.
That is the finding of this whole page in its sharpest form. Cover priced for a whole workforce pays back more than cover sold one person at a time, because a group policy is negotiated once by somebody doing it professionally while an individual policy carries the cost of being sold to you. It is the same gap as group against individual term life further up, and vision has the widest version of it on the page.
Individual dental needs one correction before it can be read at all. As the report prints it the figure is 88%, and that is not a dental number: the top row of that table is a carrier reporting state Medicaid contracts through this exhibit — fourteen policies covering three million lives — with claims the premium column does not carry. That single row moves the line 23 points. Taking the Medicaid rows out is what leaves 65%. Vision needs almost none of it: the same filter moves it by less than a tenth of a point.
Blended back together these come to 79% for dental and 67% for vision, against the 81% and 73% the health industry report publishes — both still in the table below — and the reason they differ is coverage rather than disagreement. Dental and vision are written out of all three annual statement blanks, and this report takes all three: $33.7B of dental against the $16.4B the health blank alone writes. The life blank writes more dental than the health blank does, because Ameritas, Guardian, MetLife, Sun Life and Unum are life filers, so a dental figure taken from the health industry report is a figure for about half the market. Neither number corrects the other. This one is measured across more of the market, and on the same claims-over-premium basis as the property/casualty lines above it.
Health insurance is measured differently from the property/casualty lines and is not strictly comparable: it comes from the NAIC’s health annual statement report for 2025 rather than the 2024 property/casualty market-share report, it is net of reinsurance where the property/casualty figures are direct, its denominator is the health blank’s revenue base rather than premium alone, and it is countrywide only because the report carries no state split.
Every line, ranked
All 48 lines — every statutory line in the market-share report, commercial ones included, plus the term-life and health rows that report does not carry. Best payback first, on the pooled 2017–2024 figure.
The 2024 columns are the same line read one year at a time, which is worth having next to the pooled number for two reasons: it is what every state edition of this piece is built from, and it is the only basis that carries the cost of handling claims — adjusters, investigators, defence — which is a real part of where the premium dollar goes but is not money that reaches a policyholder. Where the two columns are far apart, the line is one whose losses arrive by weather.
| Line | 2017–2024 | 2024 | 2024 + handling | 2024 premium |
|---|---|---|---|---|
| Flood (federal, NFIP) ‡ | 111% | 241% | 242% | $3.2B |
| Private Crop ‡ | 97% | 92% | 92% | $1.5B |
| Federal employee health (FEHBP) ◆ | 94% | — | — | — |
| Other health ◆ | 91% | — | — | — |
| Comprehensive health ◆ | 91% | — | — | — |
| Medicaid managed care ◆ | 91% | — | — | — |
| Medicare Advantage ◆ | 90% | — | — | — |
| Medicare Supplement ◆ | 87% | — | — | — |
| Multiple Peril Crop ‡ | 86% | 86% | 86% | $16.4B |
| Dental (group) ◇ | 81% | — | — | — |
| Dental ◆ | 81% | — | — | — |
| Term life (group) † | 75% | — | — | — |
| Allied Lines ‡ | 73% | 50% | 51% | $29.7B |
| Vision ◆ | 73% | — | — | — |
| Commercial Auto Liability | 73% | 78% | 86% | $52.7B |
| Pet ¶ | 72% | 72% | 72% | $4.3B |
| Auto (commercial) | 70% | 73% | 80% | $68.5B |
| Private Passenger Auto Liability | 69% | 71% | 75% | $196.0B |
| Farmowners ‡ | 68% | 63% | 64% | $6.3B |
| Vision (group) ◇ | 68% | — | — | — |
| Auto (personal) | 68% | 66% | 68% | $350.3B |
| Homeowners ‡ | 68% | 62% | 63% | $162.6B |
| Private Passenger Auto Physical Damage | 67% | 60% | 60% | $154.3B |
| Dental (individual) ◇ | 65% | — | — | — |
| Other Liability | 63% | 71% | 81% | $116.8B |
| Warranty / service contracts | 60% | 68% | 68% | $3.4B |
| Commercial Auto Physical Damage | 60% | 58% | 59% | $15.8B |
| Total Commercial Multiple Peril | 60% | 54% | 61% | $64.6B |
| Financial Guaranty | 56% | — | — | — |
| Aircraft | 56% | 54% | 60% | $2.9B |
| Dwelling fire ‡ | 56% | 41% | 43% | $29.0B |
| Ocean Marine | 55% | 53% | 56% | $5.4B |
| Medical Professional Liability ¶ | 53% | 55% | 72% | $12.7B |
| Excess workers Compensation | 53% | — | — | — |
| Aggregate Write-Ins for Other Lines of Business | 50% | 50% | 55% | $1.9B |
| Products Liability ¶ | 50% | 62% | 82% | $5.3B |
| Workers Compensation | 49% | 50% | 58% | $61.1B |
| Inland marine | 49% | 44% | 45% | $33.0B |
| Vision (individual) ◇ | 48% | — | — | — |
| Term life (individual) † | 45% | — | — | — |
| Flood (private) ‡ | 44% | 44% | 45% | $1.3B |
| Credit insurance | 41% | 50% | 51% | $3.0B |
| Boiler and Machinery | 38% | 28% | 29% | $2.7B |
| Burglary and Theft | 37% | 24% | 23% | $618M |
| Fidelity | 36% | 37% | 37% | $1.4B |
| Surety | 19% | 24% | 27% | $9.8B |
| Mortgage insurance (PMI) | 5% | 6% | 6% | $6.0B |
| Earthquake ‡ | 3% | 2% | 2% | $5.3B |
| All property/casualty lines | 63% | 62% | 66% | $1,018.7B |
Earned premium and direct losses summed over 2017–2024 and divided once, countrywide, from the NAIC property/casualty market-share reports; the 2024 columns are that year alone, from the same reports’ state tables. ‡ marks a catastrophe-exposed line, where the single year and the pooled figure can be very far apart. † marks term life, which comes from the life annual statement on a different basis and countrywide only. ◆ marks health, which comes from the NAIC health industry report for 2025 on a third basis, also countrywide only — see the notes below. ◇ marks dental and vision split into the cover bought through an employer and the cover bought on your own, which is a split the health industry report does not carry. Those four come from the NAIC Accident and Health Policy Experience Report for 2024: claims over premium, direct, across all three annual statement blanks — $33.7bn of dental against the $16.4bn the health blank alone writes. That is a different and larger population from the countrywide dental and vision rows, so the two are not directly comparable and neither corrects the other. Medicaid dental is excluded from the individual half: a handful of carriers report state Medicaid contracts through this exhibit with claims the premium column does not carry, and one such row — fourteen policies covering three million lives — moves that line by 23 points on its own. ¶ marks a line the reports do not cover for the whole window, pooled over what they do: pet (2024 only), medical professional liability (2017–2021), products liability (2017–2021).
Your state
The same ranking, run for each state on its own numbers — because the national figure is an average of fifty very different markets, and the line that pays back best where you live is often not the one that pays back best countrywide.
Alabama · Alaska · Arizona · Arkansas · California · Colorado · Connecticut · Delaware · District of Columbia · Florida · Georgia · Hawaii · Idaho · Illinois · Indiana · Iowa · Kansas · Kentucky · Louisiana · Maine · Maryland · Massachusetts · Michigan · Minnesota · Mississippi · Missouri · Montana · Nebraska · Nevada · New Hampshire · New Jersey · New Mexico · New York · North Carolina · North Dakota · Ohio · Oklahoma · Oregon · Pennsylvania · Rhode Island · South Carolina · South Dakota · Tennessee · Texas · Utah · Vermont · Virginia · Washington · West Virginia · Wisconsin · Wyoming
How this was built
The property/casualty figures pool the NAIC market-share reports over 2017–2024 — direct earned premium and direct losses, countrywide, for every statutory line. That report is the whole industry rather than a sample of carriers, which is what makes a ranking off it a statement about the market. Lines are grouped the way the report groups them, so private passenger auto liability is 19.1 and 19.2 together and the "Auto" bar on the chart is liability and physical damage combined.
Countrywide figures are pooled over 2017–2024: earned premium and direct losses are summed across every year the NAIC market-share reports publish, then divided once, so a line is judged on eight years of experience rather than on whichever year the weather was bad. They cover states, U.S. territories, Canada and aggregate other alien business — about a percent wider than the state tables — and, unlike the single-year figures, exclude the cost of handling claims, which the summary table does not publish. Pet insurance was reported inside inland marine through the 2023 data year and became its own line in 2024, so the pooled inland marine figure spans a change in what the line covers, and pet pools 2024 alone.
The loss ratio excludes the cost of handling claims; the tables above show that variant too where the report carries it. It also excludes reinsurance — these are direct figures, what the insurer collected from and paid to policyholders, before it laid any of the risk off. And it is eight years rather than one, which is enough to stop a single hurricane season deciding a line's rank but not enough to price a once-in-a-century earthquake.