
Which insurance actually pays back in Arizona
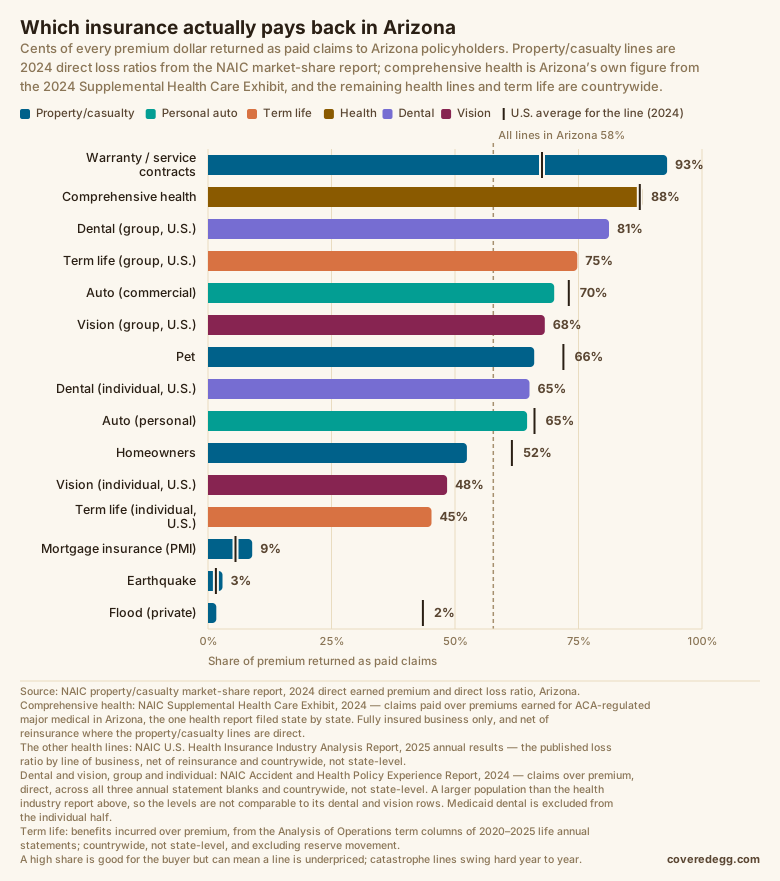
The short version: Of every dollar of insurance premium Arizonans paid in 2024, 58% came back out as paid claims — 4 points less than the national 62%. Underneath that average the spread is wide: of the lines Arizona households actually buy, warranty / service contracts paid back the most at 93%, while flood (private) paid back the least at 2%. Every consumer line Arizona writes, ranked, with the national figure marked against each one.
What the number is
Insurers report, for every state they write in, how much premium they earned there and how much they paid in claims there. The ratio of the two — the direct loss ratio — is the share of a Arizona premium dollar that went back to Arizona policyholders as claims. The rest paid for commissions, advertising, claims handling, overhead, taxes and profit.
Higher is generally better for the buyer, with two caveats that matter as much here as anywhere: a line paying out far more than it collects is underpriced and about to be repriced, and the catastrophe lines swing so hard year to year that one year says very little. 2024 is a single year.
Where Arizona is not the country
Most lines land close to their national figure — the products are the same everywhere and so is the arithmetic. These are the ones that do not, among lines with enough premium in Arizona for the gap to mean something:
- Flood (private) pays back 2% here against 44% nationally — 42 points less, on $17M of premium.
- Warranty / service contracts pays back 93% here against 68% nationally — 25 points more, on $32M of premium.
- Homeowners pays back 52% here against 62% nationally — 10 points less, on $3.1B of premium.
Every line written in Arizona, ranked
| Line | Arizona | U.S. | Gap | Premium in Arizona |
|---|---|---|---|---|
| Private Crop ‡ * | 215% | 92% | +123 pts | $4M |
| Federal employee health (FEHBP, U.S.) ◆ | — | 94% | — | — |
| Warranty / service contracts | 93% | 68% | +25 pts | $32M |
| Other health (U.S.) ◆ | — | 91% | — | — |
| Medicaid managed care (U.S.) ◆ | — | 91% | — | — |
| Medicare Advantage (U.S.) ◆ | — | 90% | — | — |
| Comprehensive health ◆ | 88% | 87% | +1 pt | $5.9B |
| Medicare Supplement (U.S.) ◆ | — | 87% | — | — |
| Multiple Peril Crop ‡ | 82% | 86% | -4 pts | $151M |
| Dental (group, U.S.) ◇ | — | 81% | — | — |
| Dental (U.S.) ◆ | — | 81% | — | — |
| Commercial Auto Liability | 75% | 78% | -3 pts | $972M |
| Term life (group, U.S.) † | — | 75% | — | — |
| Vision (U.S.) ◆ | — | 73% | — | — |
| Private Passenger Auto Liability | 72% | 71% | +1 pt | $4.9B |
| Auto (commercial) | 70% | 73% | -3 pts | $1.2B |
| Vision (group, U.S.) ◇ | — | 68% | — | — |
| Pet | 66% | 72% | -6 pts | $81M |
| Dental (individual, U.S.) ◇ | — | 65% | — | — |
| Auto (personal) | 65% | 66% | -1 pt | $8.3B |
| Credit insurance | 62% | 50% | +12 pts | $28M |
| Other Liability | 61% | 71% | -10 pts | $1.9B |
| Products Liability | 54% | 62% | -8 pts | $89M |
| Private Passenger Auto Physical Damage | 54% | 60% | -6 pts | $3.5B |
| Homeowners ‡ | 52% | 62% | -10 pts | $3.1B |
| Total Commercial Multiple Peril | 51% | 54% | -3 pts | $973M |
| Inland marine | 51% | 44% | +7 pts | $632M |
| Commercial Auto Physical Damage | 51% | 58% | -7 pts | $261M |
| Fidelity | 49% | 37% | +12 pts | $17M |
| Vision (individual, U.S.) ◇ | — | 48% | — | — |
| Farmowners ‡ | 48% | 63% | -15 pts | $23M |
| Aircraft | 48% | 54% | -6 pts | $88M |
| Medical Professional Liability | 46% | 55% | -9 pts | $268M |
| Term life (individual, U.S.) † | — | 45% | — | — |
| Allied Lines ‡ | 43% | 50% | -7 pts | $309M |
| Dwelling fire ‡ | 40% | 41% | -1 pt | $355M |
| Workers Compensation | 36% | 50% | -14 pts | $866M |
| Burglary and Theft * | 29% | 24% | +5 pts | $10M |
| Aggregate Write-Ins for Other Lines of Business | 23% | 50% | -27 pts | $25M |
| Ocean Marine | 21% | 53% | -32 pts | $40M |
| Surety | 17% | 24% | -7 pts | $207M |
| Mortgage insurance (PMI) | 9% | 6% | +3 pts | $170M |
| Boiler and Machinery | 4% | 28% | -24 pts | $39M |
| Earthquake ‡ | 3% | 2% | +1 pt | $24M |
| Flood (private) ‡ | 2% | 44% | -42 pts | $17M |
| Financial Guaranty * | 0% | — | — | $1M |
| All property/casualty lines | 58% | 62% | — | $19.2B |
Direct earned premium and direct loss ratio, 2024, in Arizona, from the NAIC property/casualty market-share report. ‡ marks a catastrophe-exposed line whose one-year ratio should not be read as its normal level. † marks term life, which comes from the life annual statement on a different basis and countrywide only. ◆ marks health. Comprehensive health is Arizona’s own figure, from the NAIC Supplemental Health Care Exhibit for 2024 — the one health report filed state by state — and its U.S. column is that exhibit’s countrywide total, so the two sides of the gap are the same measure. The other health lines come from the NAIC health industry report for 2025 and are countrywide only. ◇ marks dental and vision split into the cover bought through an employer and the cover bought on your own, which is a split the health industry report does not carry. Those four come from the NAIC Accident and Health Policy Experience Report for 2024: claims over premium, direct, across all three annual statement blanks — $33.7bn of dental against the $16.4bn the health blank alone writes. That is a different and larger population from the countrywide dental and vision rows, so the two are not directly comparable and neither corrects the other. Medicaid dental is excluded from the individual half: a handful of carriers report state Medicaid contracts through this exhibit with claims the premium column does not carry, and one such row — fourteen policies covering three million lives — moves that line by 23 points on its own. * marks a line with too little premium in Arizona for its ratio to mean much — those are listed for completeness but left off the chart.
Health and term life
Health and life insurers file different annual statements from property/casualty insurers, and almost nothing in them has a state column. One thing does: every health insurer files the NAIC's Supplemental Health Care Exhibit state by state for ACA-regulated major medical — the plan you buy on the marketplace and the plan an employer buys for you — so the comprehensive health bar on the chart above is Arizona's own number rather than a national one shown for scale.
Of every dollar of major-medical premium earned in Arizona in 2024, 88% went back out as paid claims — 1 point more than the 87% it returned countrywide. That is $5.9B of premium covering 951,275 people. Health pays back at that rate for a reason the rest of this page has no equivalent of: the Affordable Care Act sets a floor under the medical loss ratio and makes insurers rebate the difference when they miss it. Inside it, the three ways of buying the same cover come apart: the individual market 92%, small-group cover 84% and large-group cover 86%.
The other health lines have no state figure anywhere. Dental, vision, Medicare Advantage, Medicaid and Medigap are published countrywide only, and the life blank's Analysis of Operations has no state split at all, which is why the countrywide bars are marked "(U.S.)". Medicare and Medicaid sit in the table rather than on the chart: every bar above is cover sold on an open market, and those are priced against government rate-setting instead.
Nationally, group term life returns 75% of premium as benefits and individual term life returns 45%. Health runs from 90% on medicare advantage down to 73% on vision, on the 2025 statement year. Dental and vision are each really two markets, and a separate report for 2024 splits them: dental bought through an employer pays back 81% against 65% bought on your own, and vision bought through an employer pays back 68% against 48% bought on your own. The full breakdown of both is in the national edition.
Read next
Which insurance actually pays you back — the national ranking, with the full explanation of what the measure does and does not say. And how much of your premium actually comes back as claims for why the loss ratio is worth knowing before you shop.
How this was built
The property/casualty figures are the NAIC's own market-share report for 2024 — direct earned premium and direct losses, in Arizona, for every statutory line. That report is the whole industry rather than a sample of carriers, which is what makes a ranking off it a statement about the market. Lines are grouped the way the report groups them, so private passenger auto liability is 19.1 and 19.2 together and the "Auto" bar on the chart is liability and physical damage combined.
Term life is measured differently from the property/casualty lines and is not strictly comparable: it is benefits incurred over premium, pooled across every life annual statement we hold from 2020 to 2025 rather than a single year, it is countrywide only because the life blank reports the term columns with no state split, and it excludes the movement in policy reserves that a level-term book builds up.
The health figure is ACA-regulated major medical only — the marketplace plan and the employer plan — from the NAIC’s Supplemental Health Care Exhibit for 2024, which is the one health report filed state by state. It is claims paid over premiums earned, so it is comparable in spirit to the property/casualty lines, but it is net of reinsurance where those are direct, and it covers only fully insured plans: self-funded employer coverage, Medicare, Medicaid and standalone dental or vision are not in it. The other health lines in this table remain countrywide.
Health insurance is measured differently from the property/casualty lines and is not strictly comparable: it comes from the NAIC’s health annual statement report for 2025 rather than the 2024 property/casualty market-share report, it is net of reinsurance where the property/casualty figures are direct, its denominator is the health blank’s revenue base rather than premium alone, and it is countrywide only because the report carries no state split.
The loss ratio excludes the cost of handling claims; the tables above show that variant too where the report carries it. It also excludes reinsurance — these are direct figures, what the insurer collected from and paid to policyholders, before it laid any of the risk off. And it is a single year, which is the right amount of caution to apply to any line whose losses arrive by weather.